
Create Single Test Analysis Reports
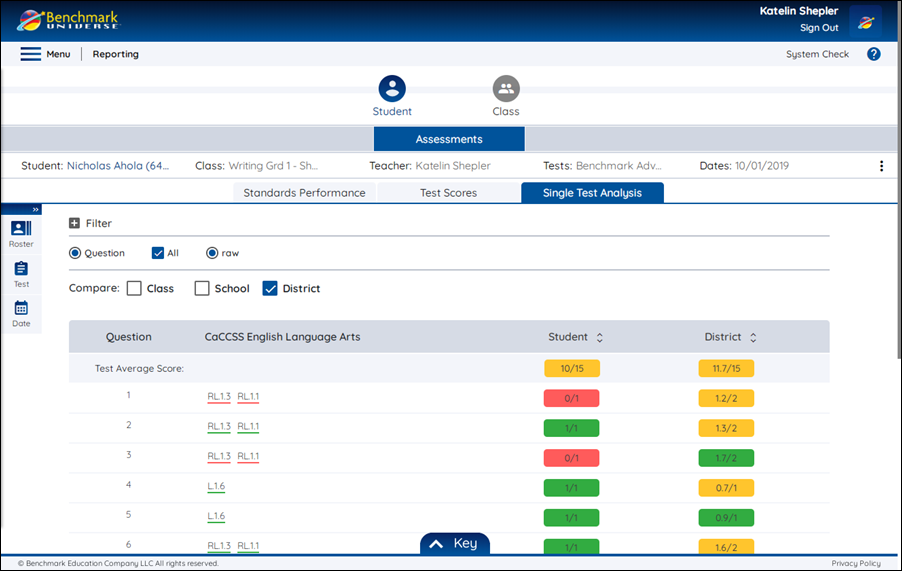
The Single Test Analysis tab in Benchmark eAssessment Reports allows teachers and administrators to analyze a single test question-by-question with all associated standards tagging.
Click image to expand.
If you're looking for a particular section about Creating Single Test Analysis Reports, use the links below to quickly move to that section:
Select a test for your Single Test Analysis Report
Customize your Single Test Analysis Report
Use the Compare buttons to display comparison data
Understanding your Standards Single Test Analysis Report
Print your Single Test Analysis
Select a test for your Single Test Analysis Report
You can access a Single Test Analysis Report by following a few simple steps.
- Access Reports.
- Select the Single Test Analysis tab from the Report Type Selector
-
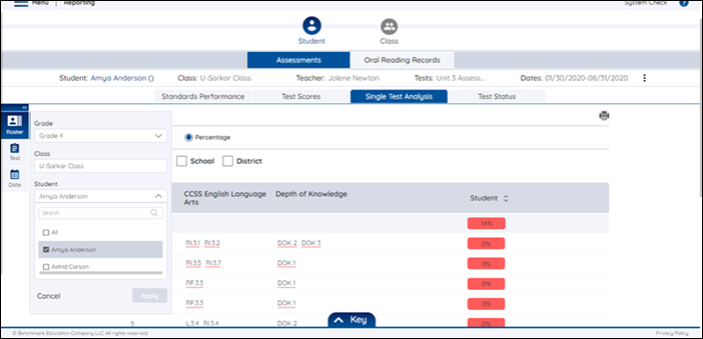
Select a class or student in the dropdown menu in the Roster tab in the Universal Selector.
- When Single Test Analysis tab is selected for the first time in a session, the tab displays the most recent test taken by that student or class.
- You can select a different test by using the Test tab in the Universal Selector and pressing Apply. Only one test can be selected at a time from the test tab when on the Single Test Analysis tab.
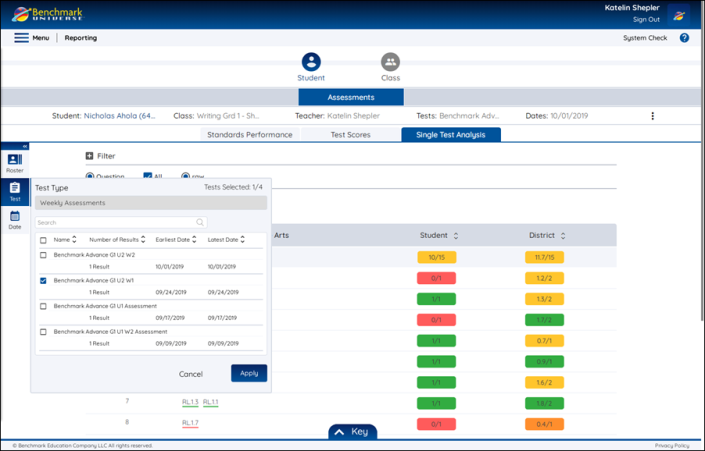

|
Teachers who want to find a Single Test Analysis report for an individual student should select Student from the Report Level Selector and then use the Roster tab's Student drop-down. Use the search function or scroll down to find a particular student. Select the student and press Apply. |
Customize your Single Test Analysis Report
1. Use the Filters to choose your display
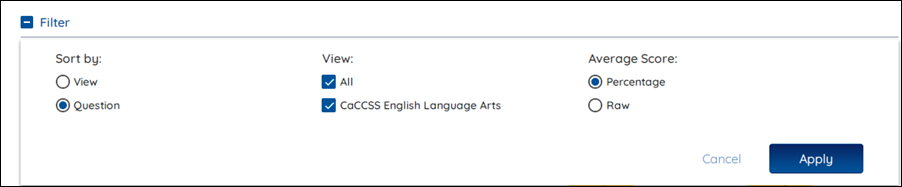
The Single Test Analysis Report provides you with two ways to sort the data when viewing Single Test Analysis reports.
a. Sort by View
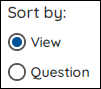
Sorting by view provides you with a report that sorts test questions by taxonomies (e.g., State or National Standards, Depth of Knowledge, etc.) addressed.
b. Sort by Question
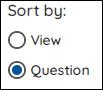
Sorting by question provides you with a report that sorts test questions sequentially in the order they appear in the test.
|
|
Clicking on a Standard in Question sorting mode switches the sorting mode to View. Clicking on a question in the View sorting mode switches the sorting mode to Filter. |
2. Select the Taxonomy
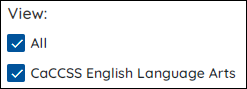
Use the buttons to select the taxonomies to include in your report (State or National Standards, Depth of Knowledge, etc.). The options available vary by district.
3. Select the Average Score filter
a. View Raw Score
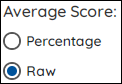
The Raw Score option is displayed as a fraction. The numerator is the points earned by a student or average points earned for the class, school, and district. The denominator is the amount of points possible to earn for the test question.
b. View Percentage
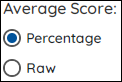
The Percentage option displays the average score of the test question in a percentage.
4. Press Apply.

Use the Apply button to create a Single Test Analysis report for the selected test.
Use the Compare buttons to display comparison data
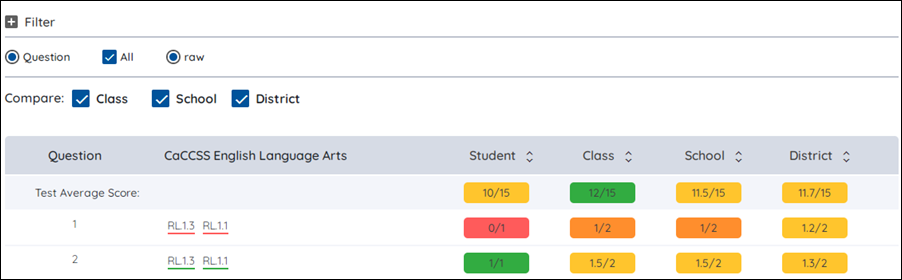
The compare buttons allow you to display the average score of the test for comparisons to class, school, and district.
Understanding your Standards Single Test Analysis Report
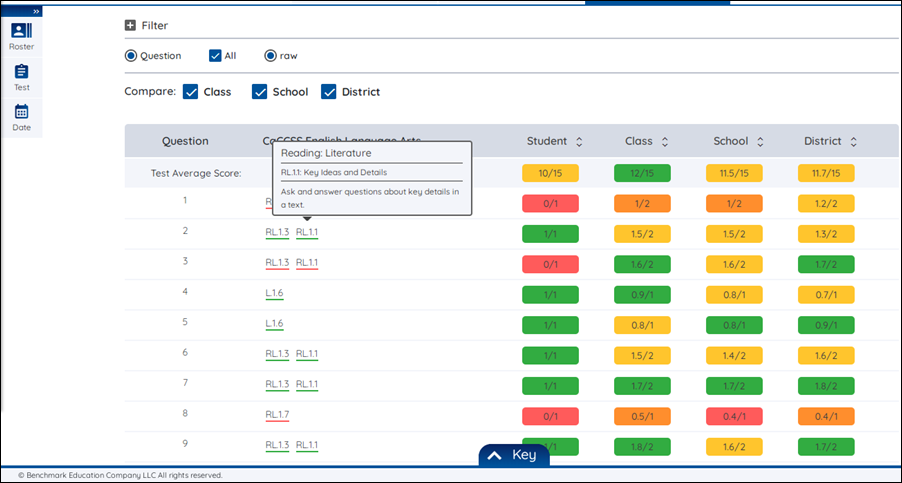
You can hover on a standard or taxonomy and raw or percentage score in the navigation area to get more information.
Hovering over a standard or taxonomy ID (e.g., RL.1.1 or DOK.1) in the Single Test Analysis Report provides teachers and administrators with the description.
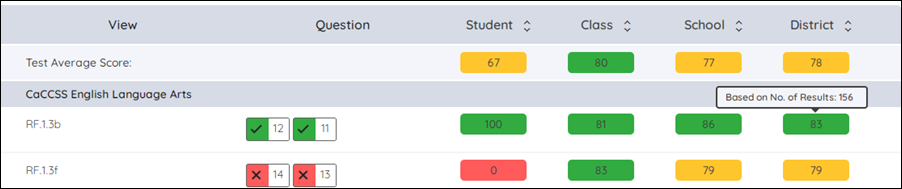
Hovering over a raw or percentage score will tell you how many students have taken the question(s).

|
Use the sorting arrow to change the display order of the score. |
Use the Key
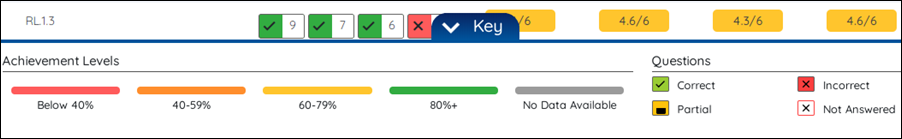
Use the Key to refresh your knowledge of the symbols used in the Single Test Analysis:
 - Correct
 - Incorrect
 - Partial
 - Not Answered
Print your Single Test Analysis
You can create a print record of your Single Test Analysis report by following a few simple steps.
- Create a Single Test Analysis Report.
- Press the Print icon at the upper-right of the Single Test Analysis page and follow your printer’s instructions.
- Select the Current Selection in the Print Report Options and select the Print button.
- Follow your printer’s instructions.
|
|
These instructions explain how to print an individual student report. To learn about printing Single Test Analysis Reports in batches, see Batch Print Reports. |
Last Updated: February 14, 2024